Port containerized throughput Ranking 2017
Work area(s)
Topic(s)
Port containerized throughput Ranking 2017
The Infrastructure Services Unit of ECLAC updates every year its ranking of container port throughput, which shows the cargo volume in containers in 120 ports of the region, based on data obtained directly from port authorities and terminal operators. In 2017 this activity increase 6.1%, with a total volume of approximately 50.6 million TEU.
| País/ Country | Puerto/ Port | 2015 | 2016 | 2017 | ||
| 1 | Panamá | Colón (MIT, Evergreen, Panamá Port) | 3.577.427 | 3.258.381 | 3.891.209 | |
| 2 | Brasil | Santos | 3.645.448 | 3.393.593 | 3.578.192 | |
| 3 | Panamá | Balboa | 3.294.113 | 2.989.860 | 2.986.617 | |
| 4 | México | Manzanillo | 2.541.140 | 2.578.822 | 2.830.370 | |
| 5 | Colombia | Cartagena (inc. S.P.R, El Bosque, Contecar,ZP) | 2.425.277 | 2.323.787 | 2.678.005 | |
| 6 | Perú | Callao (inc. DPW/ APM) | 1.900.444 | 2.054.970 | 2.250.224 | |
| 7 | Ecuador | Guayaquil | 1.704.730 | 1.814.915 | 1.871.591 | |
| 8 | Jamaica | Kingston | 1.653.272 | 1.567.442 | 1.560.000 | |
| 9 | Argentina | Buenos Aires (incluye Exolgan) | 1.433.053 | 1.352.068 | 1.468.960 | |
| 10 | Chile | San Antonio | 1.170.184 | 1.287.658 | 1.296.890 | |
| 11 | República Dominicana | Caucedo | 826.935 | 918.542 | 1.235.801 | |
| 12 | Costa Rica | Limón-Moin | 1.108.573 | 1.177.385 | 1.199.628 | |
| 13 | Puerto Rico | San Juan | 1.223.078 | 1.270.210 | 1.199.157 | |
| 14 | México | Lazaro Cárdenas | 1.058.747 | 1.115.452 | 1.149.079 | |
| 15 | México | Veracruz | 931.812 | 965.294 | 1.117.304 | |
| 16 | Chile | Valparaiso | 902.542 | 884.030 | 1.073.734 | |
| 17 | Uruguay | Montevideo | 811.297 | 888.119 | 939.427 | |
| 18 | Colombia | Buenaventura (inc. SPR, TCBUEN y ZP) | 984.057 | 869.061 | 920.000 | |
| 19 | Bahamas | Freeport | 1.400.000 | 1.200.000 | 850.426 | |
| 20 | Brasil | Navegantes (Portonave) | 662.590 | 895.375 | 811.905 | |
| 21 | México | Altamira | 647.369 | 684.931 | 803.222 | |
| 22 | Brasil | Paranaguá | 782.346 | 725.041 | 752.250 | |
| 23 | Brasil | Rio Grande | 726.785 | 705.154 | 743.717 | |
| 24 | Honduras | Puerto Cortes | 624.302 | 621.819 | 642.218 | |
| 25 | Brasil | Itapoa | 559.005 | 547.679 | 592.304 | |
| 26 | Guatemala | Santo Tomas de Castilla | 529.450 | 614.463 | 566.539 | |
| 27 | Chile | San Vicente | 456.176 | 502.065 | 516.449 | |
| 28 | República Dominicana | Haina | 417.642 | 444.755 | 488.963 | |
| 29 | Brasil | Suape | 398.166 | 390.508 | 460.769 | |
| 30 | Guatemala | Puerto Barrios | 432.141 | 428.263 | 455.973 | |
| 31 | Chile | Coronel | 471.426 | 432.671 | 431.213 | |
| 32 | Guatemala | Puerto Quetzal | 389.329 | 427.375 | 367.239 | |
| 33 | Cuba | Mariel | 330.964 | 325.328 | 332.240 | |
| 34 | Chile | Lirquen | 164.994 | 264.149 | 311.072 | |
| 35 | Brasil | Salvador | 283.500 | 302.354 | 301.129 | |
| 36 | Costa Rica | Caldera | 235.268 | 264.371 | 289.582 | |
| 37 | Brasil | Itaguai /Sepetiba | 228.173 | 205.041 | 282.682 | |
| 38 | Brasil | Rio de Janeiro | 297.991 | 273.269 | 281.473 | |
| 39 | Chile | Iquique | 227.099 | 271.733 | 280.353 | |
| 40 | Brasil | Chibatao | 450.544 | 376.282 | 275.357 | |
| 41 | Trinidad y Tobago | Port of Spain | 298.969 | 258.704 | 252.159 | |
| 42 | Brasil | Superterminais | 108.391 | 61.821 | 251.199 | |
| 43 | Chile | Arica | 226.893 | 225.029 | 238.018 | |
| 44 | México | Ensenada | 193.420 | 191.708 | 230.185 | |
| 45 | Perú | Paita | 214.483 | 219.226 | 228.367 | |
| 46 | Brasil | Itajai | 323.565 | 208.768 | 224.546 | |
| 47 | Guadalupe | Jarry/Point-a-Pitre | 201.948 | 212.259 | 210.000 | |
| 48 | El Salvador | Acajutla | 190.708 | 202.165 | 209.903 | |
| 49 | Brasil | Pecem | 180.335 | 170.965 | 209.204 | |
| 50 | Brasil | Vitória | 208.792 | 187.631 | 192.073 |
Related content

Ports Ranking. The Top 20 in Latin America and the Caribbean in 2017
ECLAC updates every year its ranking of container port throughput, which shows the cargo volume in containers in 120 ports of the region, based on data obtained directly from port authorities and…

Ports Ranking. The Top 20 in Latin America and the Caribbean in 2016
ECLAC updates every year its ranking of container port throughput, which shows the cargo volume in containers in 120 ports of the region, based on data obtained directly from port authorities and…
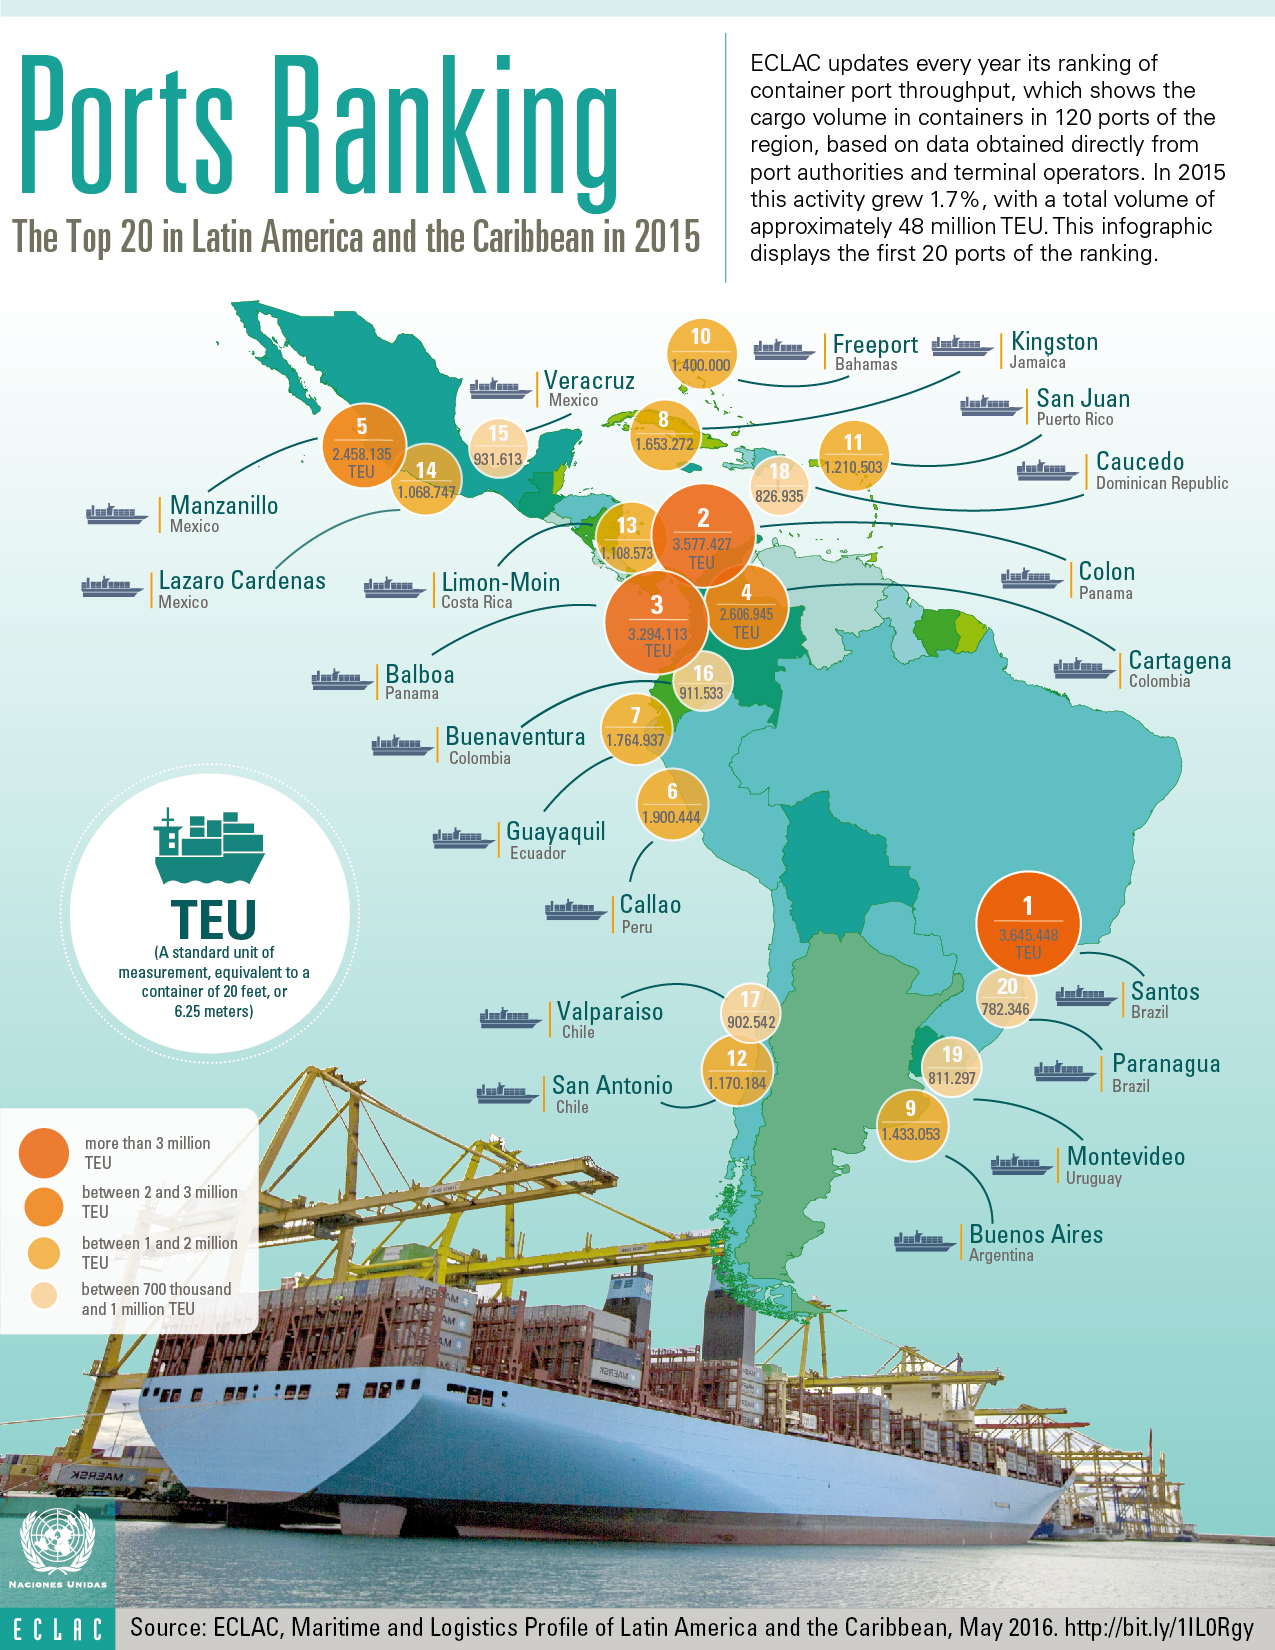
Ports Ranking. The Top 20 in Latin America and the Caribbean in 2015
ECLAC updates every year its ranking of container port throughput, which shows the cargo volume in containers in 120 ports of the region, based on data obtained directly from port authorities and…
Country(ies)
- Latin America and the Caribbean