United States – Latin America and the Caribbean Trade Developments 2022
11 Jan 2023
|
Briefing note
Work area(s)
In the United States, total trade in goods and services rebounded in 2021 to its pre-pandemic levels. In 2022, trade in goods sustained the recovery that started in 2021, but the trade in services has not fully recovered as significant services industries such as travel, and transport are still facing the lingering effects of the pandemic.
-
After the significant drop experienced during the Covid-19 pandemic, United States' total trade in goods and services rebounded in 2021 to its pre-pandemic levels.
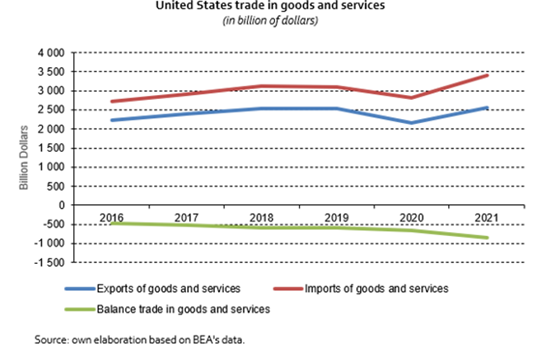
- United States total trade in goods with Latin America and the Caribbean totaled US$ 568 billion in the first six months of 2022. Goods exports totaled $ 270 billion, and imports reached $ 297 billion, resulting in a deficit for the United States of US$ 27 billion.

- Trade in services with Latin America (exports and imports) totaled an estimated US$84 billion in the first six months of 2022. Services exports totaled US$ 47 billion, and services imports totaled US$ 36 billion. The United States services trade surplus with Latin America totaled US$ 11 billion in the first six months of 2022.
- The share of trade in circular economy (CE) goods in total United States trade has been increasing since 2000, both for imports and exports, however modestly. The share of CE imports in total United States imports of goods has shown a soft upward trend that reached its maximum both in 2020 and 2021 at 0.8%. Similarly, the share of exports of CE in total United States exports of goods reached a peak in 2021 (2.5%), but with a more volatile series, with several peaks and troughs.

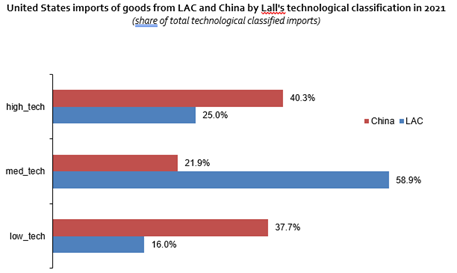
- Trade in goods between the United States and China reached US$ 633 billion in 2021, reflecting US$ 501 billion in United States imports from China and US$ 132 billion in exports. The 2021 value of United States imports from China is the second-highest amount on record after the peak of 2018. On the other side, United States exports to China reached the highest value of the series in 2021.

- Most of the United States imports from China in 2021 are classified as high technological products (40.3%), followed by low technological (37.7%), and the remaining as medium technological (21.9%). In the case of LAC, most of the United States imports belong to medium technology (58.9%), followed by high technology (25%) and low technology (16%) categories.
For a complete and detailed analysis, see the PDF attachment with the full document.
Subregional headquarter(s) and office(s)
Country(ies)
-
 United States